Application Summary
Raw data was downloaded from Wikipedia and a number of UK Gov Websites and condensed
into a single CSV file .
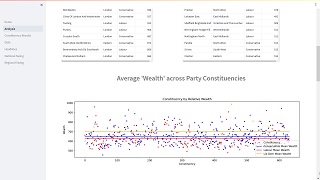
A Python application was then written using the 'Streamlit'
application framework to analyse data; compile tables and graphs
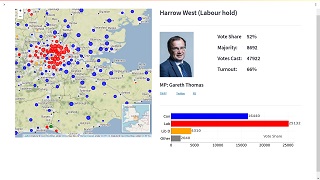
and create a geospatial map allowing the user to click on constituencies
and obtain election data about that constituency.
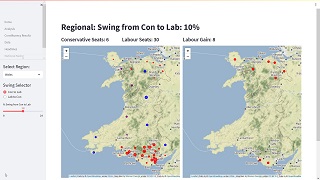
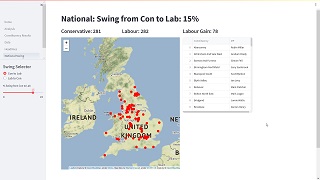
It also provides a geospatial map showing what the political map would
look like given particular percentage swings from one party to another.
The Application
All graphs, figures, tables and geospatial maps were created in real-time using the raw data.
|
|
|
|